tiny.london: isometric pixel-art map of London
Why I kept it
I find this fantastic because Greater London is one drawing, about 14 billion pixels, with nowhere for a seam to form. Starkov's rule was no hand-labelled training data: a teacher model proposed the pairs, and checks against the render and OpenStreetMap rejected 31% of its attempts. The model still invented a second Tower Bridge on the water, and a local repair removed it without a seam. The map was live five days after he restarted. I may take it as inspiration for a Paris version later.
François Paupier
tiny.london13 October 2026Public source
Visit the website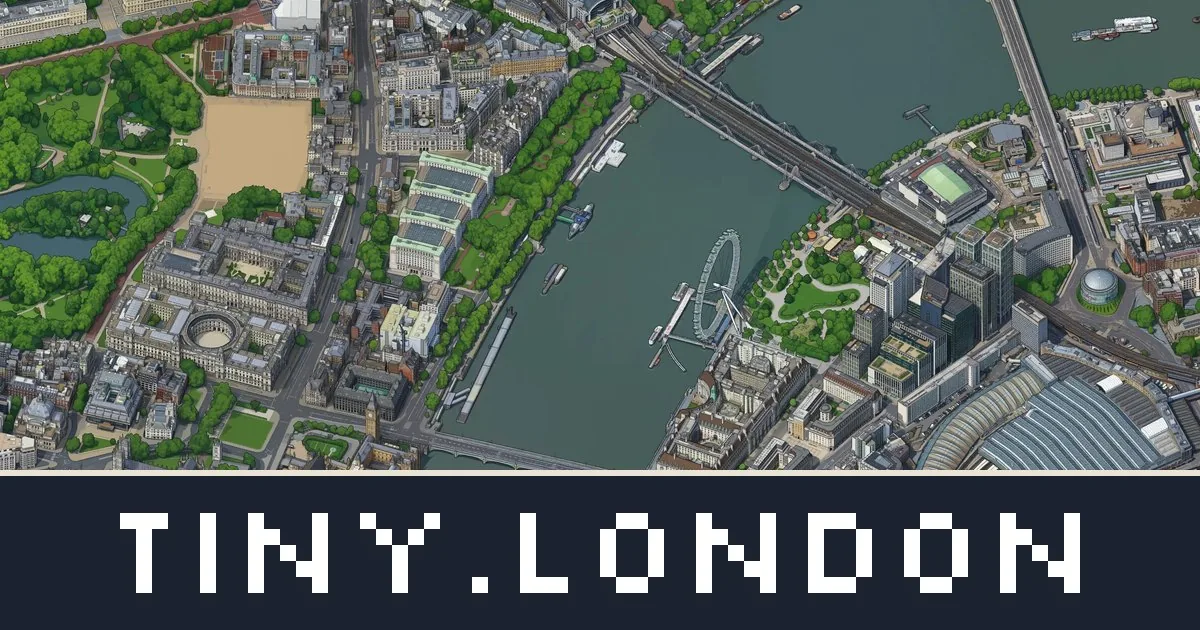
In this reference
Boris Starkov's isometric pixel-art map of Greater London: 1,591 km² and about 14 billion pixels, denoised as one image so a seam has nowhere to form.
From the site
All of Greater London as one isometric pixel-art map, about 14 billion pixels. Zoom from the whole city down to single streets, find any place, station or postcode, and share what you find.
tiny.london
Starkov renders Greater London from one camera, has an image model draw the training pairs, fine-tunes a LoRA, denoises the whole city as one latent, repairs the water, and serves the map as tiles.
The public account is Drawing all of London as one image.
The work was inspired by Andy Coenen's isometric.nyc.
Step 1
Render Greater London from one camera
One orthographic camera renders all of Greater London from Google Photorealistic 3D Tiles. The renderer is Andy Coenen's three.js scene, driven by Playwright, forked from his MIT-licensed isometric-nyc repository. The 3,570 shots are 2,048 × 2,048 pixels from a single camera at 51.507 N, 0.106 W, with the frustum shifted in whole 2,048 px steps. A shot takes about 4 seconds. The camera is tilted 45° and turned 15°, the same angles as isometric.nyc.
3,570 shots, about 4 seconds each.
Step 2
Let a teacher model draw the training pairs
Gemini 3 Pro Image, through the ElevenLabs API, redraws about 2,500 render frames as pixel art. Automatic checks against the render and OpenStreetMap reject 31% of its attempts. DINOv2 embeddings cluster 12,264 frames into 64 groups by look, so the training set covers ordinary London as well as landmarks. The scale table counts 7,277 image-model calls, about 30 seconds each. The published set is 6,326 examples.
7,277 calls, about 30 seconds each.
Step 3
Train a LoRA on one H100
ai-toolkit trains a rank-32 LoRA on an int8 Qwen-Image-2.1-Turbo: 8,000 steps, batch size 1, learning rate 1e-4. The published weights, v3, use 6,326 examples and take 3 hours 50 minutes on one H100. The training input is the render with a 2 px red outline and Coenen's infill prompt, with nyc changed to london. The writeup's total of about 70 H100-hours covers every experiment, including an earlier 4 hour LoRA on Qwen-Image-Edit.
3 hours 50 minutes on one H100.
Step 4
Denoise the city as one image
The sampler keeps one latent for the whole canvas and averages overlapping 1,024 px windows, following MultiDiffusion (Bar-Tal and others, 2023). Finished pixels are pinned with the RePaint method, and later blocks grow out of finished neighbours. Each block is 12,288 px. The final run is 125 blocks, 24,614 windows per step, and 8 steps, on a Google Cloud flex-start VM. The writeup calls that run 31 GPU-hours. Its caption records 30.6 GPU-hours of sampling and 32.5 hours on the wall clock: the VM stops after 24 hours, a watcher restarted it, and the run resumed from its last checkpoint.
31 GPU-hours. Sampling was 30.6 GPU-hours, and the wall clock was 32.5 hours.
Step 5
Repair what the model invented
OpenStreetMap water polygons, from the Geofabrik extract for London, are drawn through the same camera. Where OpenStreetMap says water and the render is flat and empty, leftover detail is an object the model invented. The first full map had 10 of these, and all 10 were real, including a second Tower Bridge and a second Palace of Westminster. Nearby water and a Poisson solve fill each hole, so the patch meets the map with no seam. The repairs changed 135 tile files. Two artifacts were kept on purpose: Big Ben in a Lea Valley reservoir near Enfield, and a blue triangle by the O2 where Google's mesh has a hole. A 2,560 px band around London, 337 render shots and 74 blocks, then clouds drawn by Gemini 3 Pro Image, covers the edge.
10 objects removed, 135 tile files changed.
Step 6
Publish the viewer
The site is a small React app around OpenSeadragon, reading a Deep Zoom pyramid of WebP tiles from Cloudflare R2. Search covers 3,180 OpenStreetMap places and every Transport for London station. Postcodes are looked up in the browser through postcodes.io. Borough outlines use Office for National Statistics boundaries. Claude Code wrote the code, put the jobs on a cloud GPU, built the training set, trained the LoRA, and ran inference. Starkov set the rules, the style, and what counted as a bug. The map went live on 13 October 2026, five days after he restarted on 8 October.
Live on 13 October 2026, five days after the 8 October restart.
Compute and estimated cost
The training run and the final image used an H100. The writeup states the chip and the hours. It does not state a price. Each figure below is an estimate from a rate of 2.80 EUR per H100-hour at the time of writing.
- LoRA v3 training
- 3 hours 50 minutes on one H100
- Estimate: (3 + 50/60) × 2.80 = 10.73 EUR, rounded to the cent.
- Final run
- 31 GPU-hours
- Estimate: 31 × 2.80 = 86.80 EUR.
- Every experiment
- about 70 H100-hours
- Estimate: 70 × 2.80 = 196 EUR. The 70 hours are the writeup's about, so this total is about 196 EUR.
The final-run caption also records 30.6 GPU-hours of sampling: 30.6 × 2.80 = 85.68 EUR at the same rate. Wall-clock time for that run was 32.5 hours, including a restart after the Google Cloud flex-start VM stopped at its 24-hour limit. The row for every experiment, about 70 H100-hours, already covers training and the final run. Those rows are separate readings of the writeup, and they are not added together. The 7,277 Gemini calls are outside this estimate. The writeup gives their count and about 30 seconds each, not a price.
Credits
- Boris Starkov (ktoya.me) built tiny.london and wrote Drawing all of London as one image. The map went live on 13 October 2026. The writeup is dated 19 October 2026 and was updated on 20 October 2026.
- Built on Andy Coenen's isometric-nyc (MIT), which supplied the renderer, the viewer, and his LoRA. His account of the New York map is how he built isometric.nyc.
- Map imagery is derived from Google Photorealistic 3D Tiles (Map data ©2026 Google).
- Water, places, and search data: © OpenStreetMap contributors, ODbL. Water polygons for the whole map come from the Geofabrik extract for London.
- Greater London and borough boundaries: Office for National Statistics, Open Government Licence v3, contains OS data © Crown copyright.
- Station and zone data: Transport for London. Postcodes: postcodes.io. Link words: the EFF short word list, CC BY 3.0.
- Models: Qwen-Image-Edit (Apache 2.0) and Qwen-Image-2.1-Turbo (Qwen Research License). Training targets and cloud drawings: Gemini 3 Pro Image, through the ElevenLabs API. Frame embeddings: DINOv2. LoRA training: ai-toolkit.
- Joint sampling follows MultiDiffusion (Bar-Tal and others, 2023). Pinned pixels use the RePaint method. The closed cloud deck is hex-tiled with random offsets, which the writeup calls Mikkelsen's trick.
- The viewer is a React app around OpenSeadragon, with tiles on Cloudflare R2. The renderer is Coenen's three.js scene, driven by Playwright.
- Claude Code wrote the code, put the jobs on a cloud GPU, built the training set, trained the LoRA, and ran inference over the whole map.
Cite the original work
Boris Starkov (13 October 2026). tiny.london: isometric pixel-art map of London [Resource]. tiny.london. https://tiny.london/
View BibTeX
@misc{tiny_london,
  author = {Boris Starkov},
  title = {{tiny.london: isometric pixel-art map of London}},
  howpublished = {tiny.london},
  url = {https://tiny.london/},
  year = {2026}
}